Note: This is a citizen's proposal, not a government project. The author has no political or vendor affiliations. Sources are linked; estimates are noted. Full methodology at the end.
In Part 1, this series proposed Makkal Kanakku — a system that listens, prioritizes, assigns, and accounts. Those four verbs are easy to say. Building them is the hard part, because Tamil Nadu is one state with two data realities: an urban layer that leaves digital traces everywhere, and a rural layer where the most reliable signals still come through people.
Makkal Kanakku is a public problem graph that combines machine-detected urban signals and human-reported rural signals into one accountable queue for government action.
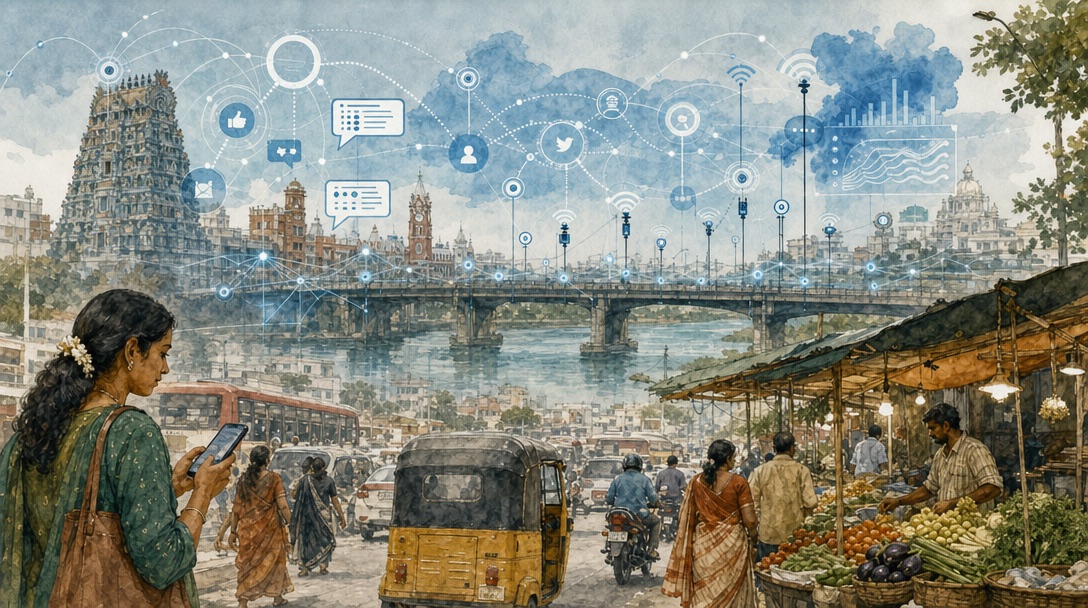
The first state is urban, connected, and loud. Chennai, Coimbatore, Madurai, Tiruchirappalli, Salem — these cities generate more structured digital data in a single day than some rural districts produce in a month. Social media posts in Tamil and English. Geo-tagged complaints on the CM Helpline app. IoT flood sensors along the Adyar and Cooum rivers. Traffic cameras. Power grid telemetry. Air quality monitors. A citizen in T. Nagar who tweets about a broken storm drain is, without knowing it, generating an input signal for Makkal Kanakku.
The second state is rural, intermittently connected, and quiet in digital terms — but not quiet at all. Dharmapuri, Ramanathapuram, Perambalur, the hill blocks of the Nilgiris. In these places, the primary sensor is not a smartphone or an API. It is a human being — a Village Administrative Officer walking between hamlets, an ASHA worker visiting a pregnant woman, an Anganwadi helper weighing a two-year-old. These workers already know what is broken. They have always known. The system has simply never asked them in a structured way.
Any architecture for Makkal Kanakku that treats these two states as one will fail. This essay lays out how to build both sensing layers and merge them into a single, prioritized problem graph.
The urban layer: machines that listen
Urban sensing is the easier half, because the infrastructure largely exists. The challenge is not building new sensors — it is connecting the ones that are already running but not talking to each other.
Channel 1: The CM Helpline and e-Sevai
The CM Helpline (1100) already processes lakhs of grievances annually across phone, web, app, email, and social media.[4] The e-Sevai portal handles millions of certificate and service requests each year through its network of Common Service Centres.[5] Right now, each complaint enters a departmental queue and lives there. Nobody outside the department knows it exists. Makkal Kanakku treats every CM Helpline ticket and e-Sevai request as a node in the problem graph — visible, trackable, and subject to automatic escalation if the deadline passes.
Channel 2: Social media in Tamil and English
Tamil Nadu has one of the most politically active social media populations in India. Every day, citizens post about waterlogging, garbage, broken roads, closed hospitals, school conditions, and electricity outages. Today, this data evaporates. A district administration might notice a viral tweet. They will not notice the fifty non-viral tweets about the same blocked drain. AI text classification — trained on Tamil, Tanglish, and English — turns social media into a structured complaint stream. Not every post becomes a ticket. But clustering reveals patterns: when forty people in Porur mention flooding on the same day, that is a signal, not noise.
Channel 3: IoT and sensor networks
Chennai already has flood-level sensors on major waterways,[6] air quality monitors from TNPCB,[7] and traffic flow data from the police. Coimbatore has smart metering pilots. The problem is that each sensor network reports to a different department, in a different format, on a different schedule. Makkal Kanakku does not replace these networks. It subscribes to their feeds and normalizes the data into a common format: location, timestamp, severity, category. When a flood sensor on the Adyar crosses a threshold and social media mentions waterlogging in the same ward, the system links them automatically. The complaint is no longer a citizen's word against the department's silence — it is corroborated by a physical sensor.
Channel 4: Infrastructure and service telemetry
Power outages reported by TANGEDCO.[8] Water supply interruptions logged by Metro Water.[9] Road-cut permits issued by the highways department. Bus breakdowns reported by MTC. Each of these is a signal about service quality. Today they sit in departmental dashboards that citizens cannot see. Makkal Kanakku publishes them. When your power goes out in Anna Nagar, you should not have to call a helpline to find out why. The system should already know, and the restoration timeline should be public.
Design principle: The urban layer adds no new burden to citizens. It does not ask people to download another app or fill another form. It listens to what they are already saying, on channels they are already using, and structures that information for accountability.
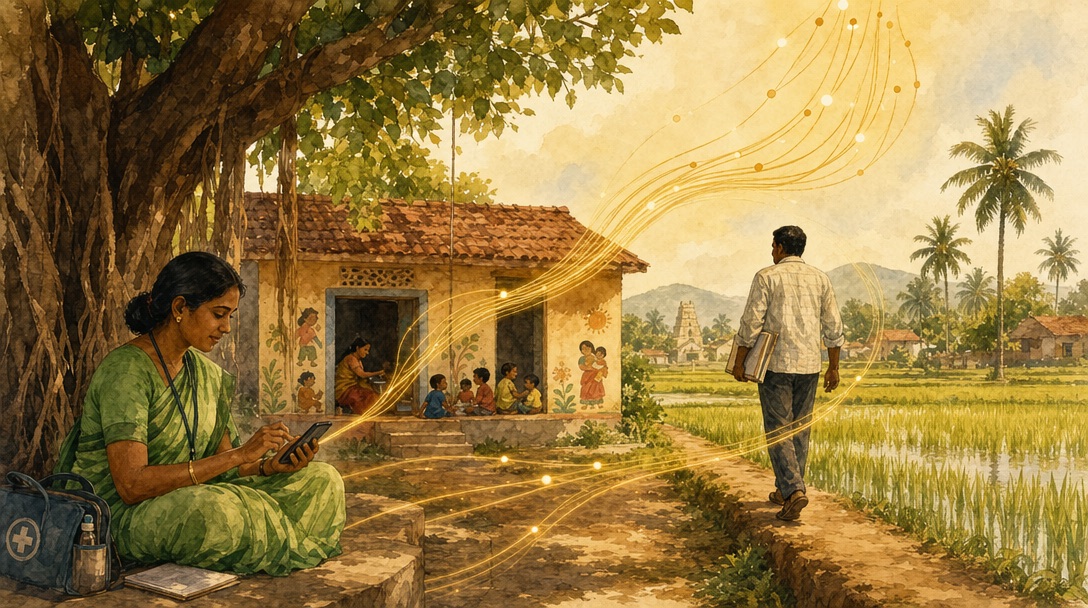
The rural layer: humans who know
Now for the harder half.
In rural Tamil Nadu, the smartphone penetration is growing but data connectivity remains patchy. A Panchayat president in interior Sivaganga may have a phone, but not reliable mobile data. An elderly farmer in Thiruvarur is unlikely to tweet about his missing pension. The digital channels that work in Chennai are, for roughly half the state — especially outside the major urban corridor — either unavailable or culturally irrelevant.
This does not mean rural areas lack sensors. They have the best sensors in the state — they just run on community knowledge.
The Village Administrative Officer (VAO)
Tamil Nadu has thousands of revenue villages, varying widely by district, each covered through the revenue administration network.[1] Every village has a VAO responsible for land records, revenue collection, and local administration. The VAO knows which fields flooded, which family lost a buffalo, which borewell ran dry, which widow has not received her pension. This knowledge is currently trapped in handwritten registers and verbal reports to the tahsildar. Makkal Kanakku gives the VAO a structured input channel — a simple form on a basic smartphone, or even an IVR-based phone call — to report the five most urgent problems in their jurisdiction every week. Not free-text essays. Structured fields: category, location, severity, number of people affected, days since onset.
ASHA and Anganwadi workers
India's ASHA (Accredited Social Health Activist) workers and Anganwadi helpers form the largest community health and nutrition network in the world.[10] Tamil Nadu has approximately 54,439 Anganwadi centres[11] and over 40,000 ASHA workers across the state.[12] These workers visit homes. They weigh children. They track pregnancies. They know which primary health centre has been without a doctor for months, which village has a diarrhea cluster, which school's midday meal has been irregular.
Currently, ASHA workers report upward through the health department, and Anganwadi workers through ICDS. Both chains are slow, paper-heavy, and disconnected from other departments. Makkal Kanakku does not replace these chains — it adds a parallel structured input. When an ASHA worker reports that the PHC in Kallakurichi block has had no doctor for 90 days, that becomes a node in the problem graph, tagged with location, category (health staffing), severity (critical — no alternative within 30 km), and affected population (estimated 8,000 residents).
Panchayat presidents and ward councillors
Tamil Nadu has over 12,500 village panchayats, each with an elected president. These are the closest elected representatives to ground reality. Most have no structured mechanism to escalate systemic issues — only political channels and personal relationships. Makkal Kanakku gives panchayat presidents a formal, tracked channel to raise infrastructure issues: a collapsed culvert, a non-functional hand pump, a school building with a leaking roof. Each submission becomes a public case with a status page. The panchayat president is no longer begging the block office — they are filing a tracked, visible, accountable request.
Design principle: The rural layer does not assume connectivity. It works on 2G. It works through IVR. It works through a literate intermediary entering data on behalf of an illiterate farmer. It meets the state where it is, not where a Bengaluru startup wishes it were.
The unified problem graph
The urban layer generates thousands of signals per day — tweets, calls, sensor readings, complaint forms. The rural layer generates hundreds — structured field reports from workers who know their communities. These are different kinds of data, arriving at different speeds, in different formats, from different trust levels. The architecture must merge them without privileging either.
Signal flow into the problem graph
| What a problem node contains | |
|---|---|
| case_id | Unique identifier, e.g. TN-CHN-2026-3847 |
| location | GPS coordinates + ward/village/district hierarchy |
| category | Department-mapped taxonomy: water → flooding, health → staffing, etc. |
| source | Origin channel(s): CM Helpline, social media, VAO report, IoT sensor, etc. |
| confidence | Signal strength: sensor-corroborated > multi-source > single report |
| severity | Composite score: affected population × time sensitivity × vulnerability |
| assigned_dept | Auto-routed department + named officer where possible |
| deadline | SLA clock: starts at case creation, escalates on breach |
| public_status | Citizen-visible state: open → assigned → in progress → resolved → verified |
| escalation_path | Next-level authority if SLA breaches: officer → collector → secretary → CMO |
The classification engine does three things:
Deduplication. Three hundred tweets about a single pothole on Cathedral Road are one problem, not three hundred. A VAO report about a collapsed culvert and a panchayat president's complaint about the same culvert are one case. The engine uses location clustering, time windowing, and semantic similarity to merge duplicate signals into single problem nodes.
Categorization. Every signal is tagged: water, roads, health, education, electricity, sanitation, revenue, law and order. Subcategories drill deeper: water → supply interruption, water → flooding, water → contamination. These categories map directly to government departments, so routing happens automatically.
Severity scoring. Not all problems are equal. The engine scores each problem node on three axes: (1) number of people affected, (2) time sensitivity — is this an emergency or a chronic issue?, and (3) vulnerability — are the affected people disproportionately poor, elderly, or in a remote area? A contaminated water source in a tribal hamlet with no alternative scores higher than a pothole on a highway with a detour. This is not a political judgment. It is triage logic, the same kind a hospital emergency room uses.
Proposed pilot structure
Urban sensing pilot: Chennai + Coimbatore — integrate CM Helpline, social media classification, and existing IoT sensor feeds into a unified dashboard.
Rural human reporting pilot: Dharmapuri + Ramanathapuram — structured weekly inputs from VAOs, ASHA workers, and panchayat presidents via IVR and basic smartphone forms.
Duration: 100 days per pilot, running in parallel.
Falsifiable targets (pass/fail at Day 100):
• Reduce duplicate grievance entries by ≥40% vs. current CM Helpline baseline
• Detect ≥200 rural issues not captured by any existing digital channel
• Cut SLA breaches by ≥25% in pilot districts
• Keep false-positive classification rate below 15%
• Publish weekly public dashboard updates for the full 100 days
• Achieve ≥70% weekly report submission rate from enrolled rural workers
Who owns this?
Architecture without ownership is a whitepaper. The unified problem graph needs a single institutional home — most likely TNeGA (Tamil Nadu e-Governance Agency), which already sits at the intersection of technology and government operations[14], or a new dedicated Makkal Kanakku Mission reporting directly to the Chief Minister's office. The CM Helpline team handles intake; TNeGA handles the platform; a dedicated mission director owns accountability for the whole pipeline. Without this clarity, the system becomes another inter-departmental committee that meets quarterly and changes nothing.
The hard parts nobody talks about
The architecture above is clean on a whiteboard. In the field, five things will go wrong immediately.
Tamil NLP is not solved. Written Tamil has significant dialectical variation — Kongu Tamil in western districts, Nellai Tamil in the south, Chennai Tamil in the capital. Tanglish (Tamil-English code-switching) is dominant on social media. Building a classifier that correctly routes a Coimbatore farmer's WhatsApp voice note and a Chennai techie's Twitter thread requires training data that does not fully exist today. The system must launch with imperfect NLP and improve continuously. Waiting for perfect accuracy means waiting forever.
Incentive misalignment in rural reporting. A VAO who honestly reports that the road in his jurisdiction has been broken for six months is, implicitly, reporting that his superiors did nothing about it. The system must protect honest reporters. VAO reports feed the problem graph — they do not feed the VAO's performance review. The performance metric for a VAO in Makkal Kanakku is report completeness and accuracy, not whether their area looks problem-free.
Rural worker protection. Reporting must not become unpaid extra work. VAOs, ASHA workers, and Anganwadi workers already carry heavy field loads. Makkal Kanakku adds a structured reporting layer, which means it must also add: a dedicated honorarium for weekly data submissions, training on the reporting tool (in Tamil, with offline materials), protection from bureaucratic retaliation for honest reporting, and offline-first tools that do not assume a data connection. If the system extracts information from frontline workers without compensating and protecting them, it will produce compliance, not honesty — and bad data is worse than no data.
Connectivity gaps. A significant share of Tamil Nadu's panchayats still have unreliable mobile data coverage, particularly in hilly and border districts.[13] The rural input channels must work on 2G voice and SMS. An IVR system — where a VAO calls a number and enters structured data via keypad — is not glamorous, but it works without a data connection. Offline-first mobile apps that sync when connectivity returns are the backup. Satellite broadband is the long-term fix, but the system cannot wait for it.
Noise and gaming. Urban social media is noisy. Political party workers will amplify grievances strategically. Opposition trolls will flood the system with fabricated complaints during election season. The classification engine needs a credibility layer: complaints corroborated by multiple independent sources score higher than isolated signals. Sensor-corroborated complaints score highest. A flooding complaint supported by an IoT water-level reading is near-certain. A single anonymous tweet is low-confidence. Both enter the graph, but at different trust levels.
Privacy and misuse controls. Urban sensing — social media monitoring, IoT data, service telemetry — can easily slide into surveillance. The design constraint is absolute: Makkal Kanakku tracks problems, not people. A flooding event is tracked by location, not by the names of residents who reported it. A health staffing gap is tracked by facility, not by the patients affected. Citizen identity is never published in the problem graph. Citizens who file formal complaints can choose to be identified or to remain anonymous. The default is anonymous.
Operational safeguards
Data minimization: Collect only what is needed to describe the problem. No biometric data, no household income, no caste or religion markers in the problem graph.
Audit logs: Every officer access to the system is logged — who viewed what case, when, and from which device. Logs are tamper-resistant and reviewable by an independent body.
Role-based access: A ward engineer sees cases in their ward. A district collector sees district-level aggregates. No officer can browse citizen-level data outside their jurisdiction.
Public/private field separation: The public-facing status page shows case_id, category, location, status, and deadline. Internal fields — reporter identity, officer notes, escalation justification — are never published.
Model bias reviews: Severity scoring and classification models undergo quarterly bias audits. If rural complaints are systematically scored lower than urban complaints of equal impact, that is a bug to fix, not a feature to accept.
Appeal and correction workflow: Citizens can dispute a case closure or severity downgrade. Disputed cases enter a separate review queue with a different officer. The dispute and its resolution are logged.
Independent oversight: An external advisory panel — including civil society, academic, and legal members — reviews system operations quarterly and publishes findings publicly.
Two worked examples
The following scenarios are illustrative — constructed to show how the system would work, not drawn from actual case data.
Illustrative Example A — Urban Chennai: The Velachery Drain
October 2026. Heavy rain. Imagine forty-seven social media posts mention flooding on Velachery Main Road within two hours. The CM Helpline receives twelve calls about the same area. A flood sensor on the Velachery canal crosses the warning threshold.
The classification engine merges all signals into a single problem node: TN-CHN-2026-3847. Category: water → flooding. Severity: high (3,000+ residents affected, flood sensor corroboration). The system auto-assigns the case to the Greater Chennai Corporation's Zone 13 drainage engineer. A 48-hour deadline is set. Status: open.
Any citizen in Velachery can search the case number and see: who is responsible, what the deadline is, and whether the flood sensor reading has dropped. If the deadline passes without resolution, the case escalates to the Corporation Commissioner's office. That escalation is public.
Illustrative Example B — Rural Dharmapuri: The Missing Doctor
An ASHA worker in Pennagaram block files her weekly report. She marks the PHC doctor vacancy as "90+ days, no alternative within 25 km, 6,200 residents affected." A panchayat president in the adjacent village files a separate report about the same PHC. The engine merges them: TN-DPI-2026-0412. Category: health → staffing. Severity: critical.
The case is assigned to the Dharmapuri District Health Officer. Deadline: 14 days for an action plan (not necessarily a permanent posting — an interim measure counts). If no action in 14 days, the case escalates to the Director of Public Health. The panchayat president can check the status page. The ASHA worker gets an SMS update when the case status changes.
No tweet went viral. No journalist covered it. The system heard it anyway, because the human sensor was structured and the channel was open.
Why this architecture matters politically
The two-speed design is not just an engineering constraint. It is a political statement.
Many high-visibility digital governance efforts in India have been urban-first, app-first, English-first. The pattern is consistent: connected, educated, vocal citizens get heard, and rural, less-connected, less-vocal citizens remain invisible. The dashboard looks good. The ground reality hasn't changed.
Makkal Kanakku inverts this. The rural sensing layer — humans filing structured reports on 2G connections — is not a compromise. It is a feature. It means the grandmother in Ramanathapuram whose pension stopped three months ago gets the same quality of intake as the IT professional in OMR whose metro construction complaint went viral on Twitter.
The unified problem graph does not care where a signal came from. It cares about severity, affected population, and time. If the most urgent problem in Tamil Nadu today is a contaminated borewell serving a tribal hamlet in the Jawadhu Hills, that problem should sit at the top of the graph — even if nobody on social media has ever heard of the Jawadhu Hills.
A democracy that only listens to the loud is not a democracy. It is a customer service desk for the connected.
The real test is not whether Tamil Nadu can build a smarter dashboard. It is whether the state is willing to hear the quietest signal with the same urgency as the loudest one.
The architecture described here is how Makkal Kanakku avoids that trap. But architecture alone is not enough. A system this powerful can be captured, gamed, or turned into a propaganda tool by whoever controls it. That is the problem Part 3 addresses.
— A citizen and a builder
If this architecture resonates — or if you see a flaw — the conversation matters more than the proposal.
Share feedback on this essayMethodology and assumptions.
This is a citizen's proposal, not a government project. The author has no affiliation with any political party, government agency, or technology vendor. Makkal Kanakku does not exist yet. The architecture, budget estimates, and timelines in this series are informed estimates based on publicly available data, not insider knowledge. Where specific figures are cited, sources are linked in the footnotes below. Where numbers are estimated (e.g., "lakhs of grievances annually"), that is noted. Population and infrastructure figures use Census 2011 data updated with the most recent government publications available at the time of writing. This series is meant to start a conversation, not end one.
Sources & references
- Revenue village administration data: Tamil Nadu Rural Development & Panchayat Raj Department (TNRD); district-wise village counts available through the Commissioner of Revenue Administration, Tamil Nadu. ↑
- Panchayat counts: TNRD lists over 12,500 village panchayats across 38 districts. See tnrd.gov.in.
- Urban/rural population: Census of India 2011 recorded Tamil Nadu at approximately 48.4% urban / 51.6% rural. Urbanization has increased since, but the rural share remains substantial. See censusindia.gov.in.
- CM Helpline (1100): The CM Special Cell and Helpline processes grievances across phone, web, app, email, and social media channels. Volumes reported in state government press releases. See tn.gov.in and cmhelpline.tnega.org. ↑
- e-Sevai: Tamil Nadu's Common Service Centre platform delivering government certificates and services. Operated by TNeGA. See tnesevai.tn.gov.in. ↑
- Chennai flood sensors: Water-level sensors installed along the Adyar, Cooum, and Buckingham Canal as part of the Greater Chennai Corporation's flood warning system and the Chennai Flood Management Project. See chennaicorporation.gov.in. ↑
- TNPCB air quality monitoring: Tamil Nadu Pollution Control Board operates continuous ambient air quality monitoring stations across major cities. Data published via CPCB CAAQMS portal. See tnpcb.gov.in. ↑
- TANGEDCO: Tamil Nadu Generation and Distribution Corporation, the state electricity utility. Outage and restoration data available through their consumer portal. See tangedco.gov.in. ↑
- Metro Water: Chennai Metropolitan Water Supply and Sewerage Board. Supply schedules and interruption data published periodically. See chennaimetrowater.tn.gov.in. ↑
- ASHA and Anganwadi workforce: India's National Health Mission (NHM) describes ASHA as the largest community health worker programme globally, with nearly 10 lakh workers nationwide. See nhm.gov.in. ↑
- Tamil Nadu Anganwadi centres: The state's ICDS programme operates 54,439 Anganwadi centres per the Ministry of Women and Child Development's state-wise data. See icds-wcd.nic.in. ↑
- Tamil Nadu ASHA workforce: Estimated at over 40,000 based on NHM Tamil Nadu's deployment figures (approximately one per 1,000 rural population). See nrhm.tn.gov.in. ↑
- Connectivity gaps: TRAI's annual reports on rural telecom density show significant variation across districts, with hilly and border areas lagging. BharatNet fibre rollout status available at bbnl.nic.in. ↑
- TNeGA: Tamil Nadu e-Governance Agency, the nodal agency for e-governance projects in Tamil Nadu, operating under the IT Department. See tnega.tn.gov.in. ↑
A note on how I write
I am not a writer. I am a person with strong opinions and scattered notes. Every essay on this site started as a messy brain-dump — half-formed arguments, bullet points, and “you know what I mean” — that I hand to an LLM. Another LLM handles the background research needed to find the facts that support an argument. And then it all gets translated into writing far too good for me to pretend is mine. The ideas are mine. The craft is not. They say blogs are dead — but I am falling in love with this. It gives me an outlet for expression that would otherwise have stayed buried in my head. I believe you deserve to know all of that.